Sample report
What the full report looks like
Example: a local dental clinic
This is an example report for a made-up business, a small dental clinic. The clinic and its numbers are invented to show you the layout. Your report is about your own website, with your own results.
The first page: where you stand
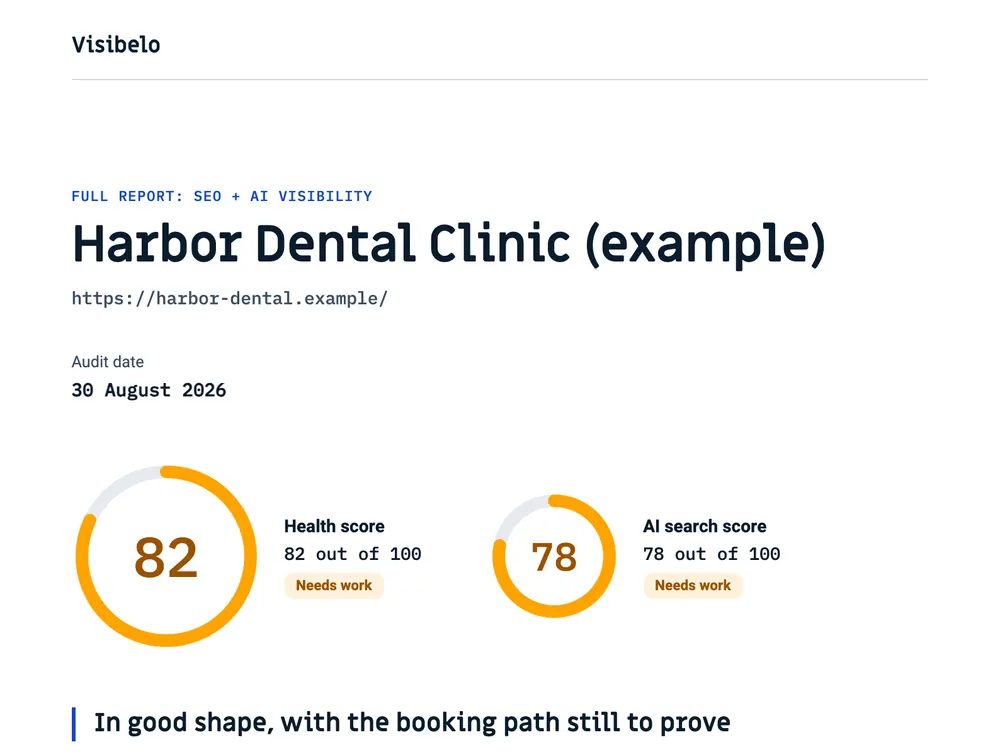
The cover gives you two numbers. The overall score says how healthy the whole site is, and the AI score says how well assistants like ChatGPT can read and quote it. Under them is one sentence that sums up the result.
How to read the score
- Below 50: something is stopping Google or AI assistants from using the site properly.
- 50 to 70: a sound base with real gaps.
- 70 to 85: a good site with a few specific things left to fix.
- Above 85: a site that competes well. The next gains come from content and reputation.
Scores by area
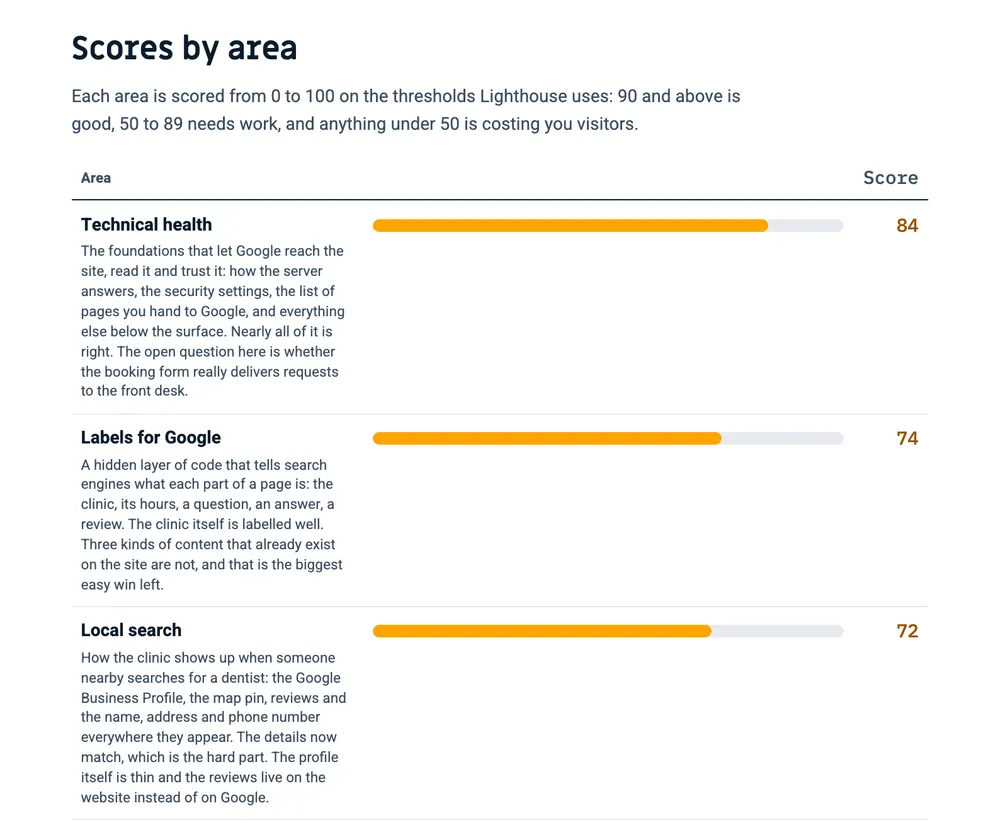
The overall score is made of seven areas. Each one gets its own score, so you can see straight away where the site is weakest.
AreaShare of the overall score
- Technical health: can Google get into every page22%
- Content: do your pages show you know your trade23%
- How you look on Google: titles, descriptions, headings20%
- Business details that Google and AI read10%
- Speed: how fast the site loads on a phone10%
- AI visibility: can assistants read and quote you10%
- Images: size and descriptions5%
Each problem, explained
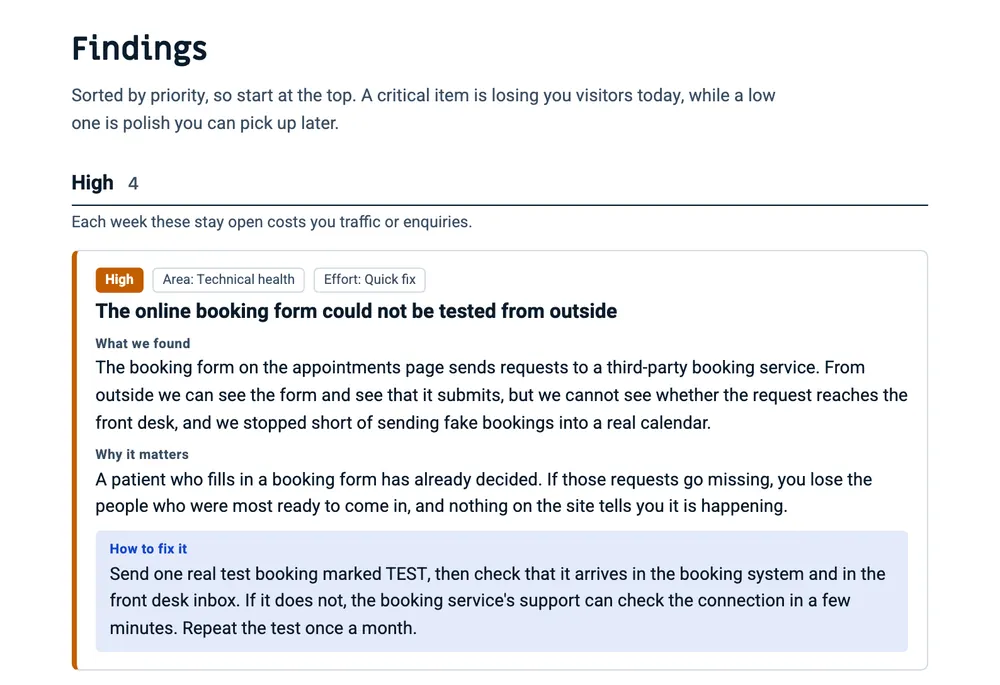
Every problem is written the same way, so you can read ten of them in a few minutes:
- What we found, in one or two sentences.
- Why it matters, in terms of customers and calls, not code.
- How to fix it, with the exact detail your web person needs.
- How big the job is: a quick fix, a few hours, or a bigger project.
Your to-do list
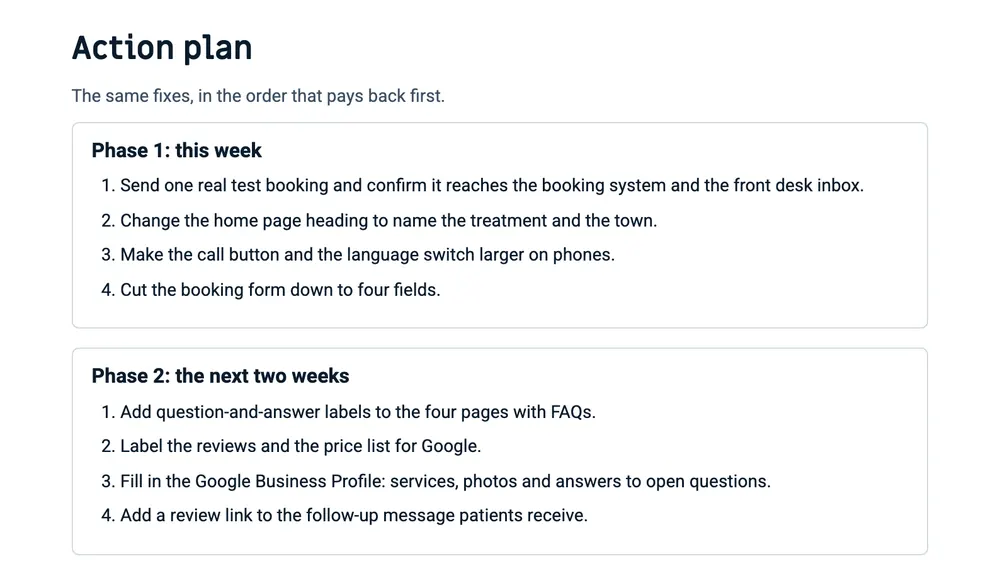
The last pages turn the problems into a plan, grouped by when to do them:
- This week: quick fixes with the biggest effect.
- The next two weeks: jobs that need a little more time or a developer.
- Later: the bigger improvements that pay off over months.
What the report can't see
Some things can't be measured from the outside, and the report says so instead of guessing. For example, if Google has too few visits on record to publish real speed data for your site, the report uses a lab test and tells you it did. It never claims to know your traffic or rankings without access to them.
Get the same report for your own website
A PDF in English or Hebrew, usually within an hour and always within 24 hours.